Google Analytics without the drama: a guide for busy business owners
You open Google Analytics, stare at a dashboard full of numbers, and close the tab. If that's your cycle, this article is for you.
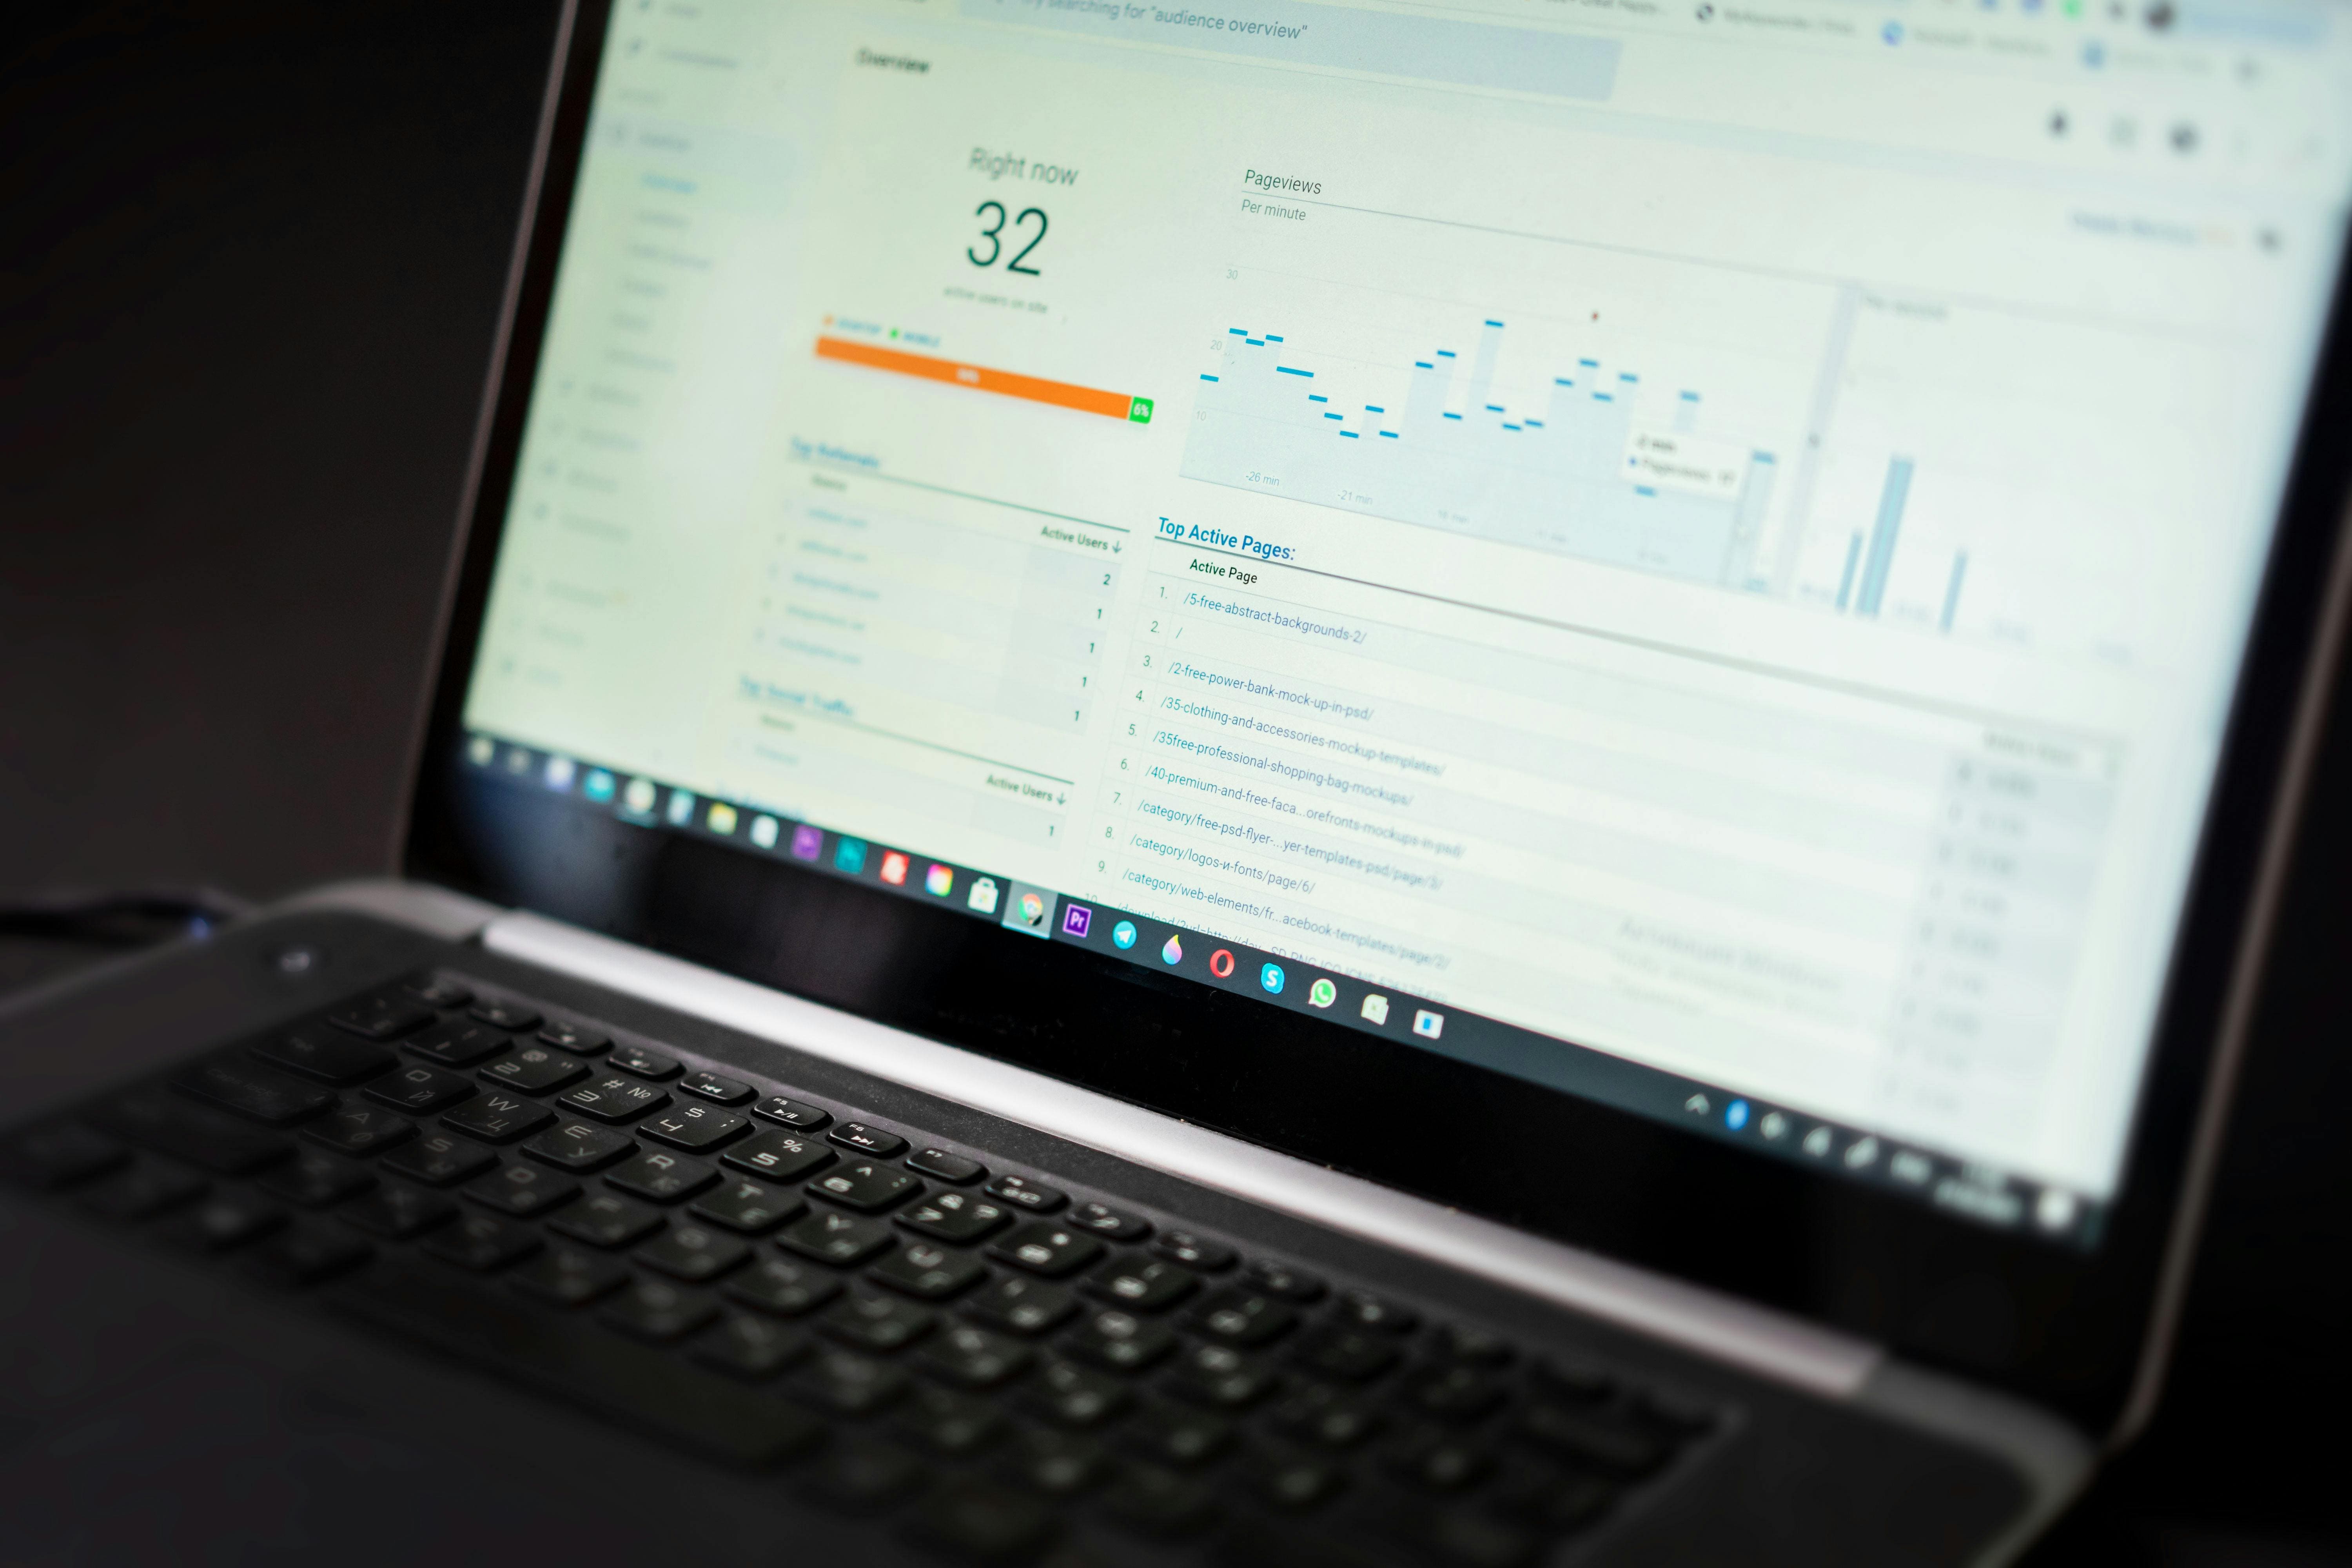

A friend of mine — he runs a physiotherapy clinic in Portugal — sent me a message: “I opened Google Analytics for the first time in months. I didn’t understand anything. I gave up.”
If you recognise yourself in this story, this article is for you. 95% of what’s in Google Analytics is irrelevant to you. Let’s focus only on what matters.
4 questions, 4 metrics, 2 minutes
Google Analytics has hundreds of metrics. Your business needs to answer four questions per week:
1. How many people visited? → Users
Reports → Acquisition → Overview. Look at Users. A user is a person — two visits from the same person count as one.
2. Where did they come from? → Sessions by channel
On the same screen, the “Sessions by default channel group” table shows whether they came from Google (Organic Search), ads (Paid Search), social media (Organic Social) or directly (Direct).
If you spend €300/month on Google Ads and Paid Search is 5% of your traffic, something is off.
3. What did they do? → Engagement rate
Reports → Engagement → Overview. A healthy rate sits between 55% and 70%. Below 40%, the problem is the wrong audience, the wrong page, or a slow site.
4. Did anyone become a customer? → Conversions
Only works if you’ve set up conversion events — forms, purchases, calls. Without conversions configured, Google Analytics is a speedometer without a destination.
If you haven’t set up conversions yet, stop everything and configure them this week.
The rule that changes everything: trends, not numbers
Never look at a number in isolation. “847 visitors this week” means nothing. “847 this week, compared to 612 last week” — now you have information.
Use the Compare button in the top right of every report. Numbers alone are noise. Trends are signal.
Example: 4 numbers, 30 seconds
Online cosmetics shop, Lisbon. Last 7 days vs previous:
- Users: 1,240 (+18%) ✅
- Organic Search: 52% of traffic ✅
- Meta Ads: 8% of traffic, costs €200/month ⚠️
- Conversions: 23 (-12%) ❌
In 30 seconds you know: traffic growing, Meta Ads underperforming, something broken in conversion. 4 numbers. 2 minutes. No 50 reports.
The honest part
Doing this just for Google Analytics is already real work. But most businesses live across Google Analytics, Search Console, Google Ads, Meta Ads, Instagram. Each with its own dashboard, its own language, its own isolated numbers.
This is where Raveki lives. Connect your platforms, and it alerts you when something actually changes — no dashboards to open.
For now, take this away: open Google Analytics on Mondays, look at the 4 numbers, compare with last week, make a decision. Starting is more important than being perfect.
Written by

João
Founder, Raveki
Know what changed in your marketing. Without having to look.
Connect your platforms and Raveki alerts you when something matters — no dashboards, no daily check-ins.